Coding Agent Index v2.1: Scores, Cost and How It Works
Artificial Analysis released Coding Agent Index v2.1, and the headline result is a three way tie at 58 points: Claude Code with Fable 5.2, Claude Code with Opus 5.5, and Devin Fusion CLI combining Opus 5.5 with GPT-6 Luna. The index does not score a model on its own. Each row is a model plus an agent harness, run end to end on software engineering tasks, with reliability, token usage, cost and execution time reported from the same attempts.
The score drop from v2.0 needs the right reading before anything else. The v2.0 leader, Opus 5.5, scored 61.7. The v2.1 leaders score 58 on a harder test, not on the same test. Two of the three component benchmarks changed version in this release, and on FrontierCode the overall average fell from 45% to 29%. Artificial Analysis itself stresses that comparisons only hold inside one version, and this release is a clear case of that rule.
Composition and changes in v2.1
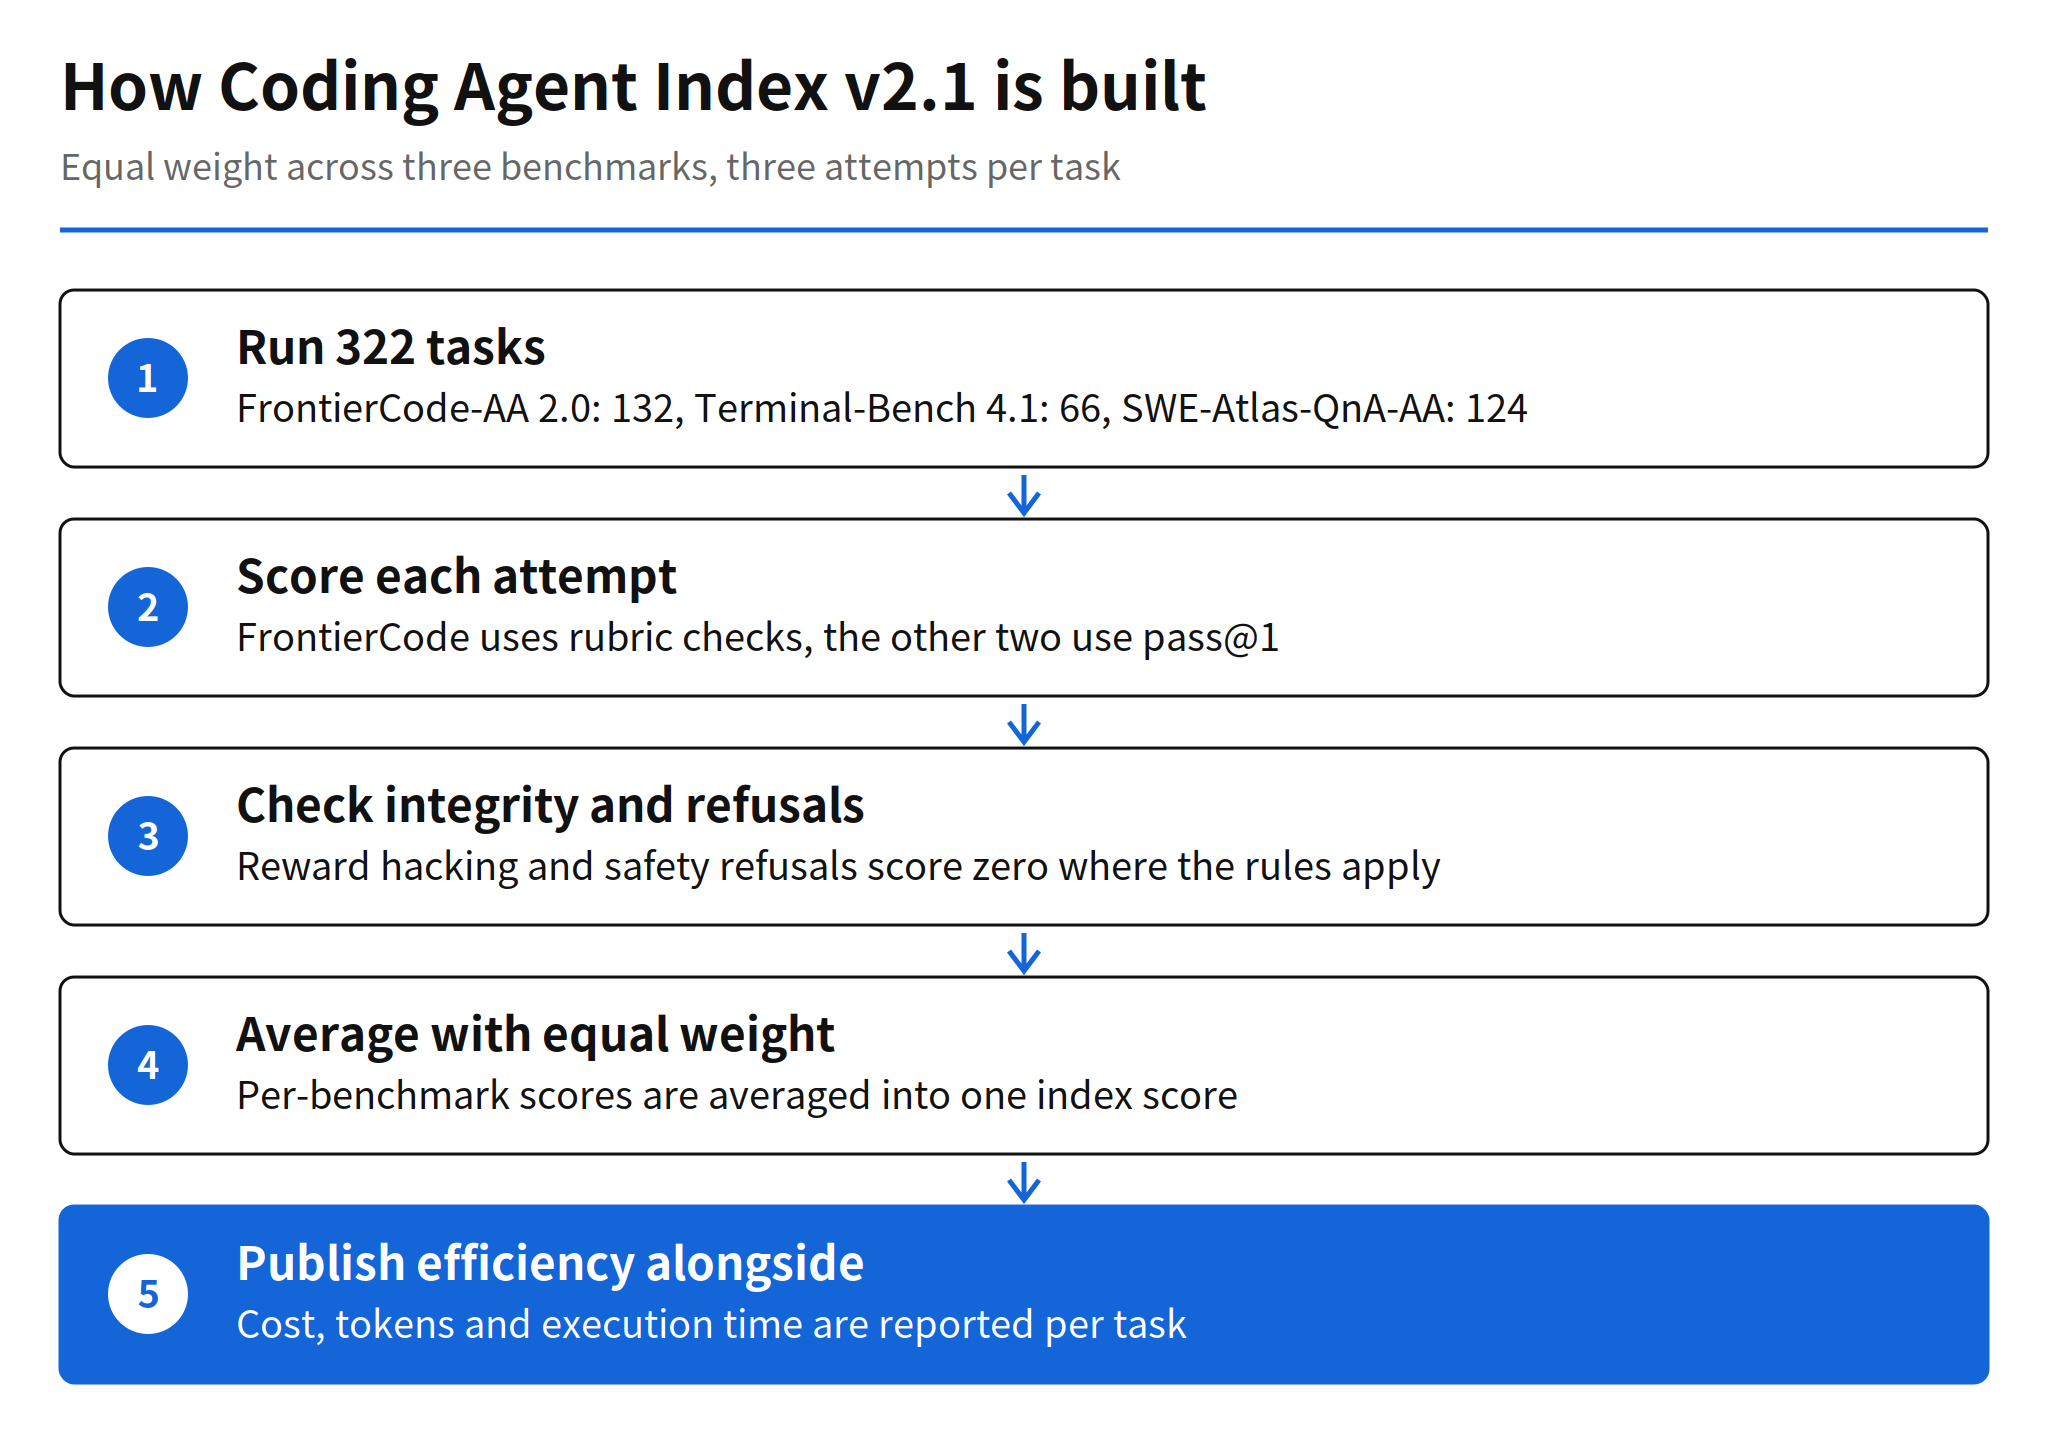
Version 2.1 is the equal weight average of three benchmarks. Each agent variant runs three attempts per task, the attempts are averaged per task, and each task carries equal weight inside its benchmark. The three benchmark scores are then averaged into the single index number.
| Benchmark | Field | Tasks | Scoring |
|---|---|---|---|
| FrontierCode-AA 2.0 | Software engineering | 132 | Zero if a blocking check fails, otherwise 70 to 100% |
| Terminal-Bench 4.1 | Agentic terminal use | 66 | Test suite pass or fail, pass@1 |
| SWE-Atlas-QnA-AA | Repository question answering | 124 | Task Resolve Rate, pass@1 |
FrontierCode changed the most. The earlier FrontierCode v1.1 component is now FrontierCode-AA 2.0, the Artificial Analysis implementation of Cognition FrontierCode 2.0, with the same 132 tasks, tests and rubrics. Grading asks whether a maintainer would merge the change, and a rule based integrity scanner plus an LLM judge look for reward hacking. Terminal-Bench moved from 4.0 to 4.1 with the same 66 tasks and updated verifiers: code the agent wrote now runs as an untrusted user during grading, and verifiers that rejected valid solutions were corrected. SWE-Atlas-QnA-AA kept its 124 tasks and 1,306 rubric criteria, with GPT-6 Luna at xhigh as judge and five votes per criterion.
Top scores and per benchmark leaders
The tie at 58 hides different strengths underneath. On FrontierCode 2.0, Fable 5.2 led the field at 49% while the overall average across agents was 29%. On Terminal-Bench 4.1, the leader was a different stack entirely: Kimi Code CLI with Kimi K3.1 Pro at 68%. That split is the practical value of publishing per benchmark scores next to the index. A team doing repository implementation work and a team doing terminal heavy operations work should not read the same single number and stop there.
The Devin Fusion CLI result points in the same direction. A harness that routes between Opus 5.5 and GPT-6 Luna reached the same 58 as two single model Claude Code setups. As harnesses gain routing, fallback and tool control, the harness share of the result grows, and a model only leaderboard becomes a weaker guide to what a buyer will actually run.
Cost per task and the efficiency gap
The widest gap in v2.1 is not score, it is price. Claude Code with Fable 5.2 cost $2.89 per task at medium effort and $44.22 per task at maximum effort, a rise of more than fifteen times for the top scoring configuration. Codex with GPT-6.1 Sol scored 52 at maximum effort and cost $1.51 per task. Six index points separate those two maximum effort runs, while the cheaper run costs about one twenty ninth as much per task.
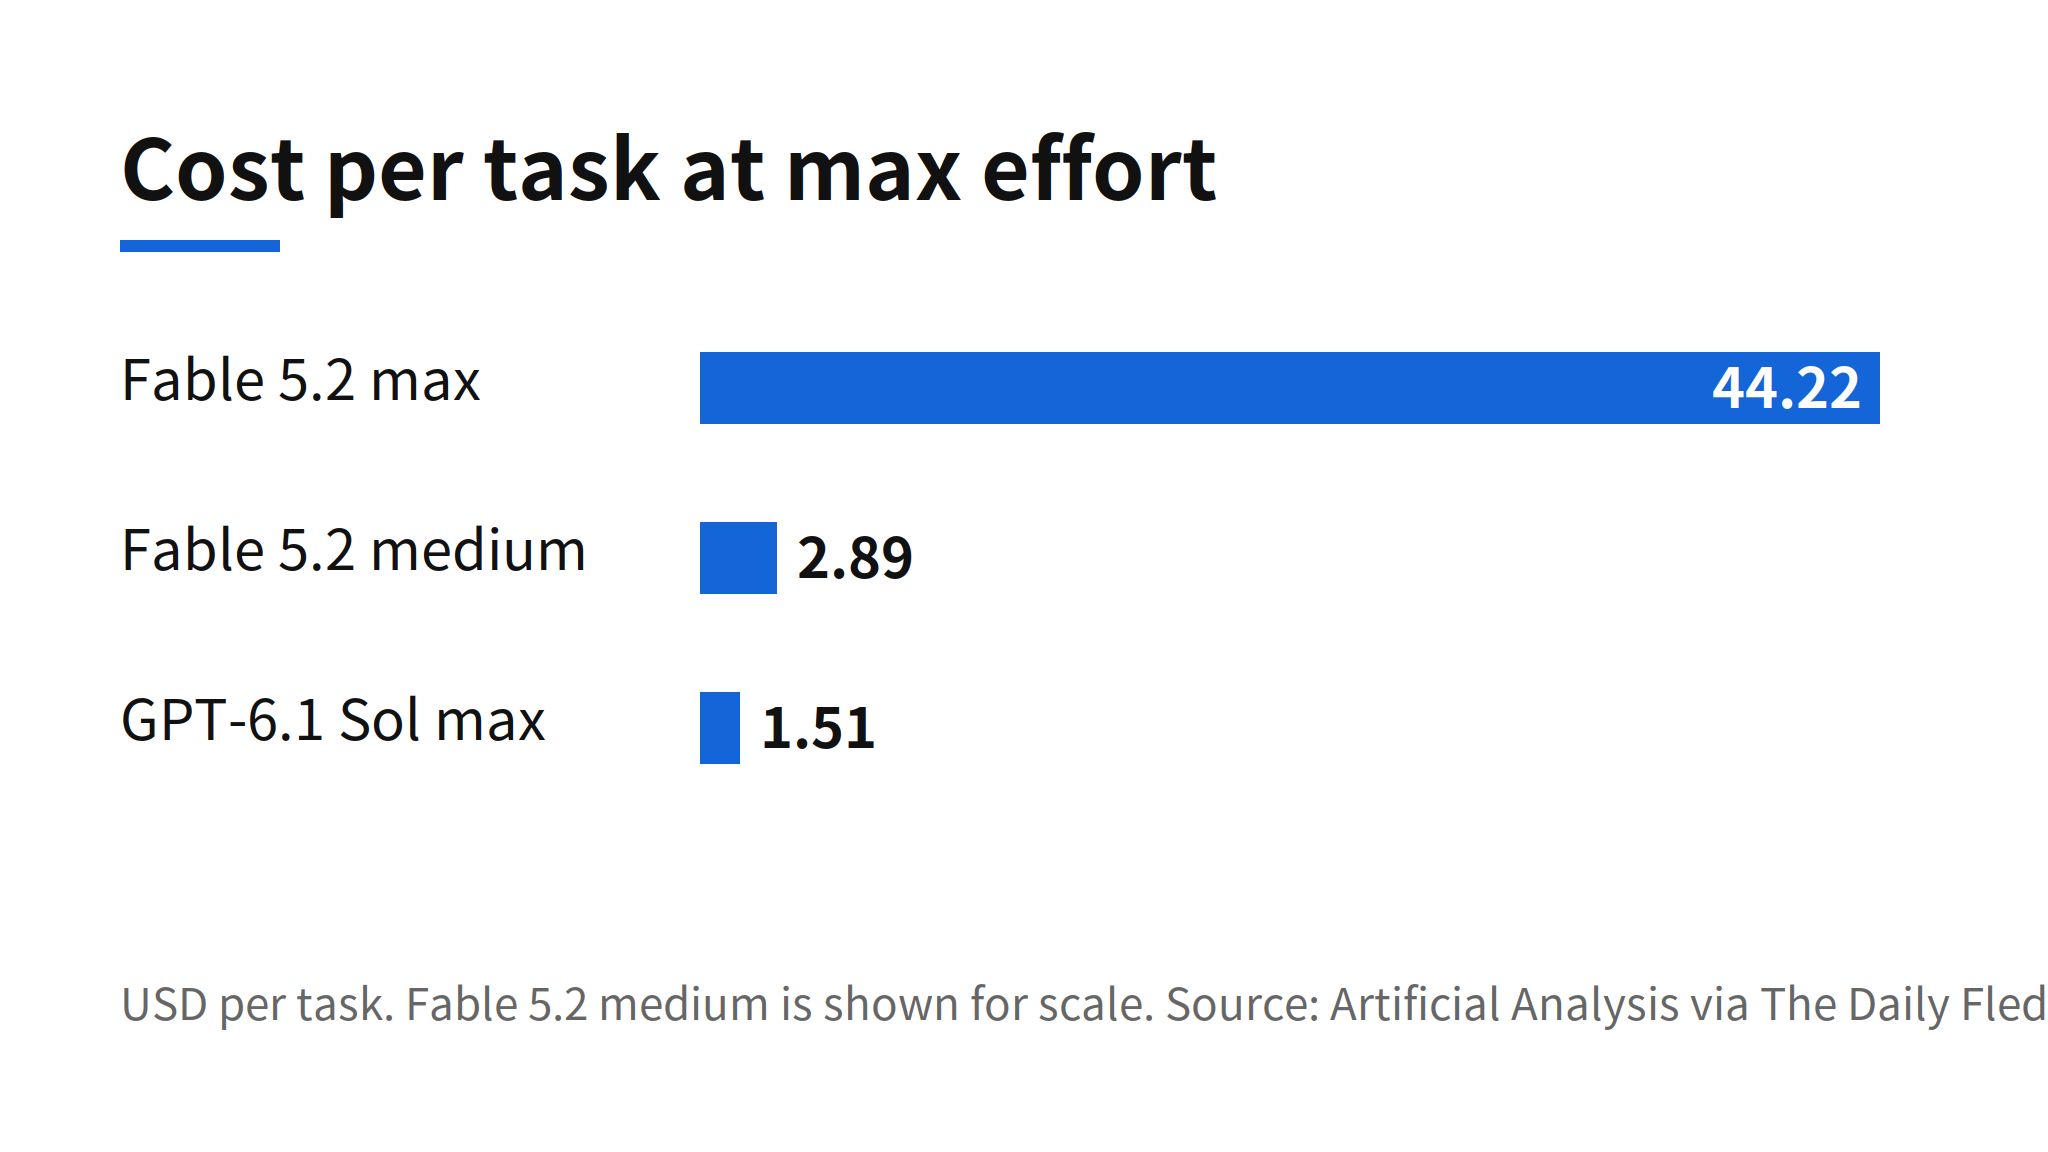
Cost in the methodology is pay per token API cost, built from provider reported token counts combined with live measurements of each model typical cache hit rate, including cache write charges where providers bill for them. It is not a consumer plan price, so a team on a flat subscription will see a different bill shape. The relative ordering still matters for API based deployment, where a benchmark run of hundreds of tasks at $44.22 per task is a budget line, not a rounding error. Execution time and token usage come from the same attempts, and missing telemetry is excluded from averages rather than counted as zero.
Integrity checks, safety refusals and fallback
Version 2.1 treats cheating and refusal as scored events, not footnotes. An attempt that edits its own grading tests, copies a bundled reference solution, or fetches the upstream solution scores zero for reward hacking, and only attempts that would otherwise have passed count toward the published reward hacking rate. On FrontierCode, softer signals such as fetching from a repository mirror go to an LLM judge, named in the methodology as Claude Opus 5.5, which can also zero the score.
Safety handling is split into two paths. A refusal that ends the attempt scores zero, with provider safety errors retried up to ten times before that zero is final. A fallback is different: the agent switches to another model, often a less capable one, and the completed attempt is scored normally. Fallback was observed in up to 9% of attempts in Claude Code and Devin. For security tasks in the suite, which include finding and exploiting vulnerabilities, that rate is part of the real capability picture, because a blocked attempt can cost at most its share of index points and a fallback attempt quietly changes which model produced the result.
Limits and unverified points
Three limits should stay attached to any use of these numbers. First, the FrontierCode tasks are not publicly released, so outside teams cannot rerun the same conditions and check the scores independently. Second, judge choice is a live variable: GPT-6 Luna judges SWE-Atlas-QnA-AA and the FrontierCode rubric, and how much that choice moves rankings has not been separately verified. The source issue flags this as unconfirmed, and it remains unconfirmed here. Third, some secondary coverage described the v2.1 mix as FrontierCode v1.1 and Terminal-Bench 4.0. The official methodology page lists FrontierCode-AA 2.0 and Terminal-Bench 4.1, and this article follows the methodology page.
The previous version, v2.0, was released on October 23, 2026 and replaced DeepSWE with FrontierCode v1.1. Version 2.1 is therefore the second benchmark swap in about three weeks. That pace makes the index useful as a current snapshot and weak as a long time series. A buyer comparing agents today gets a like for like table inside v2.1; a buyer tracking progress across months needs the per benchmark history and the version changelog, not a line drawn through index scores from different mixes.
Related articles
- StateBench: Frontier Models Fall to 13% on State Tracking
- CompressionBench Results: Coding Agents Compress LLMs
FAQ
What is the Coding Agent Index v2.1?
It is an Artificial Analysis index that scores a model and agent harness combination, not a model alone. Version 2.1 is the equal weight average of FrontierCode-AA 2.0, Terminal-Bench 4.1 and SWE-Atlas-QnA-AA, covering 322 tasks in total.
Which agents scored highest in v2.1?
Three combinations tied at 58 points: Claude Code with Fable 5.2, Claude Code with Opus 5.5, and Devin Fusion CLI combining Opus 5.5 with GPT-6 Luna. On FrontierCode 2.0 alone, Fable 5.2 led at 49 percent, and on Terminal-Bench 4.1, Kimi Code CLI with Kimi K3.1 Pro led at 68 percent.
Why is the v2.1 top score lower than the v2.0 top score?
The top score fell from 61.7 in v2.0 to 58 in v2.1 because the benchmark mix became harder. FrontierCode was replaced with a harder implementation and its overall average fell from 45 percent to 29 percent, so the drop does not mean model performance regressed.
How much does a top scoring run cost per task?
Claude Code with Fable 5.2 cost $2.89 per task at medium effort and $44.22 per task at maximum effort. Codex with GPT-6.1 Sol scored 52 at maximum effort and cost $1.51 per task, which shows why cost per task matters alongside the headline score.