gputaskman Release: Per-Process VRAM and KV Cache View
gputaskman is a terminal GPU task manager that answers the question a normal task manager leaves open. Windows Task Manager can say 15 GB used. It does not say whether that memory is model weights, a KV cache, a browser, or the desktop compositor. gputaskman lists every process with its VRAM, its spill into system RAM, and its GPU engine activity, and for LLM processes it goes one layer deeper and splits the allocation into weights, KV cache and compute buffers.
The repository was created on November 3, 2026, and reached 2,705 stars and 125 forks in 10 days, about 271 stars a day, under the MIT license. The code is Python, the current PyPI version checked for this article is 0.4.1, and the supported ground is local GPU work only: LLM inference, training and fine-tuning, vision, speech, graphics and video on your own machine. Cloud services, CPU-only and NPU-only workloads are explicitly out of scope.
That scope is the point. Anyone running local models has hit the same wall: a model will not load, or a second server will not start, and the only evidence is one aggregate number. The useful question is never how full the GPU is. It is which process holds the memory, and inside an inference server, how much of the footprint is the model itself and how much is the context you asked for. gputaskman is built to answer both halves in one screen.
What the Overview Screen Shows
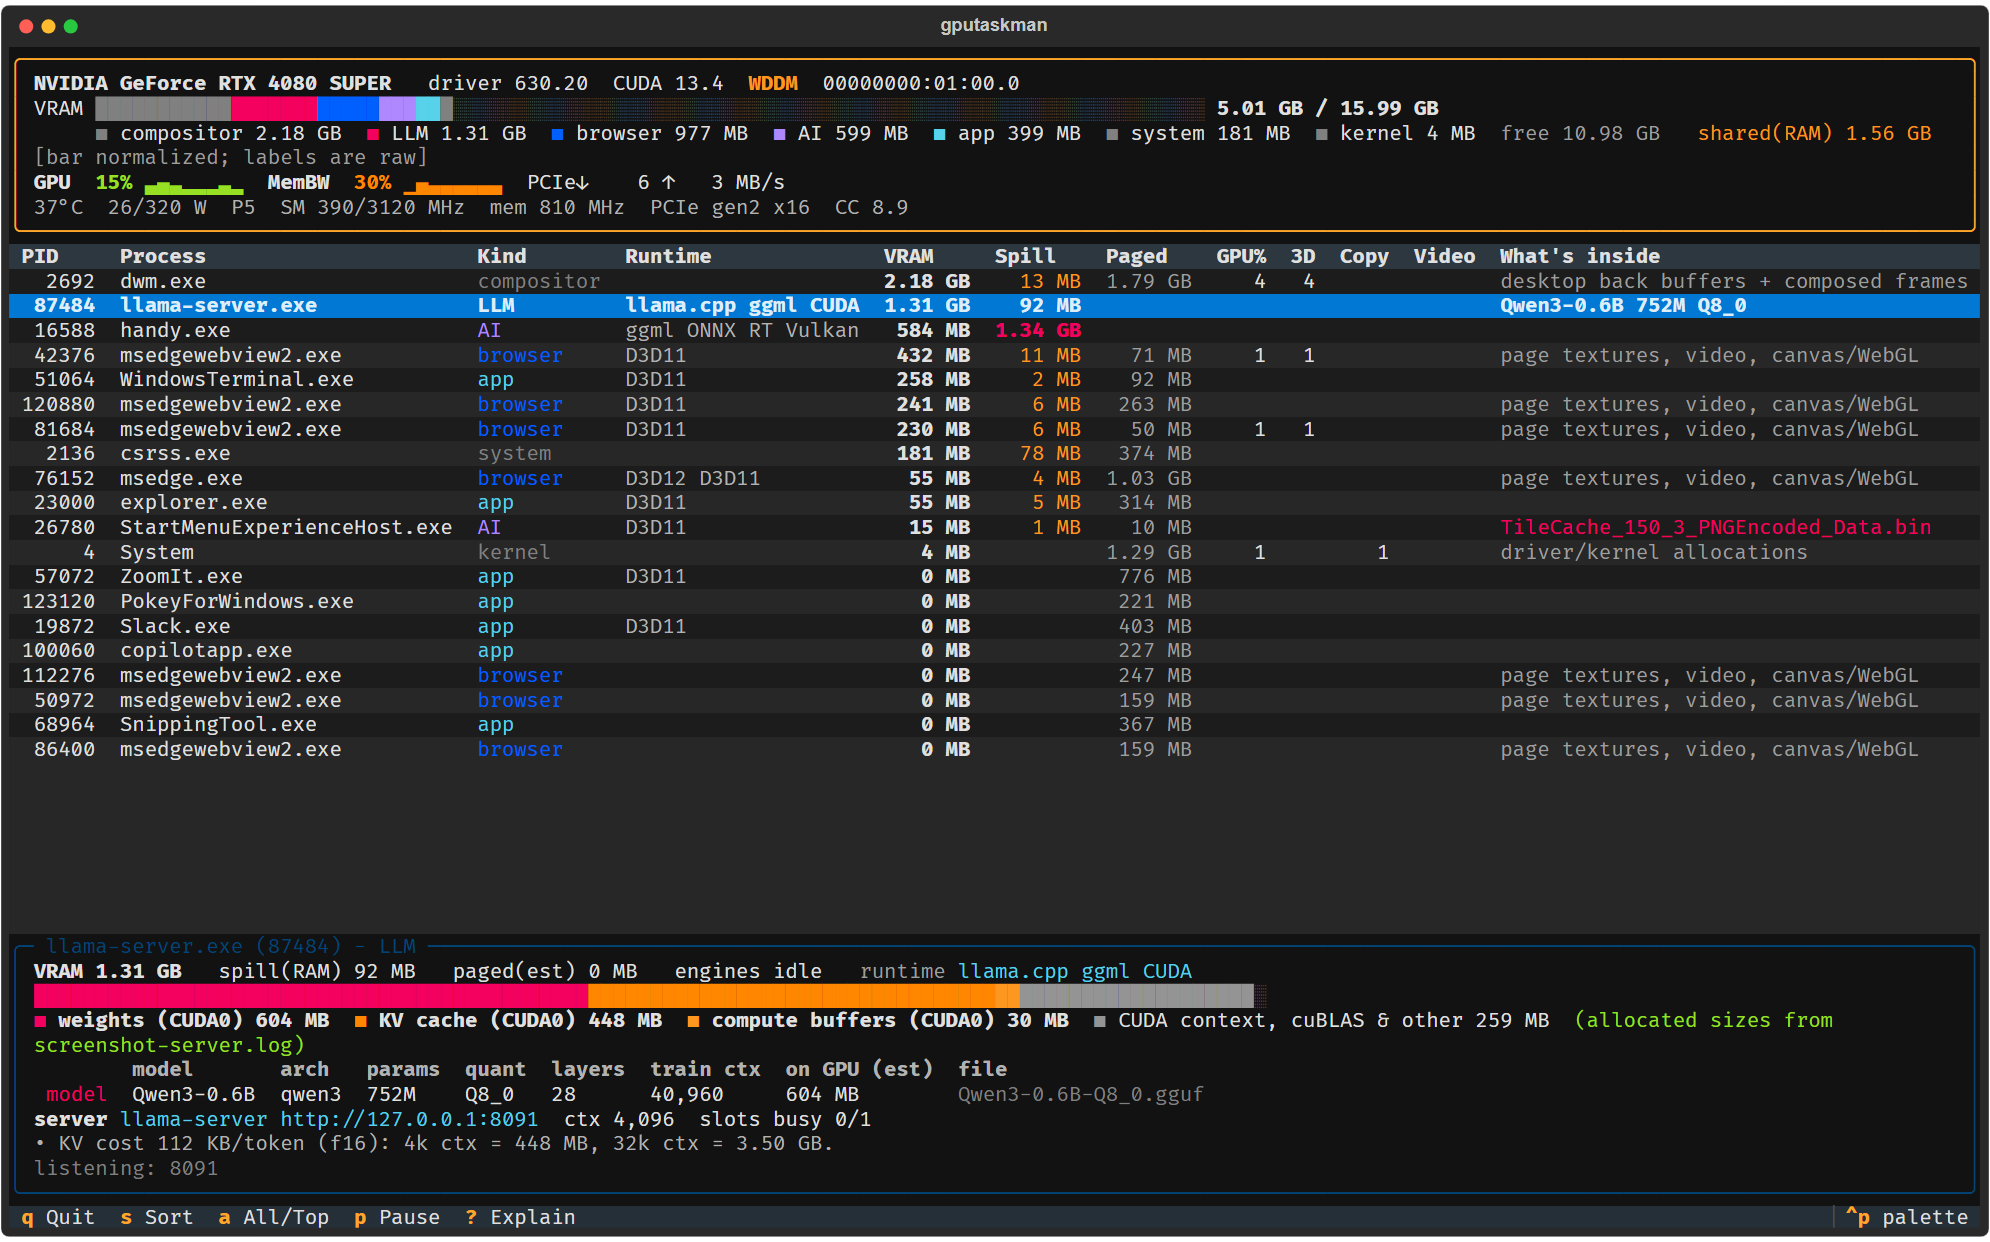
The project's own screenshot runs on an RTX 4080 SUPER with 5.01 GB of 15.99 GB in use and 10.98 GB free. The largest single holder is not a model at all. The desktop compositor, dwm.exe, holds 2.18 GB. The LLM group totals 1.31 GB, browsers 977 MB, other AI processes 599 MB, apps 399 MB, system 181 MB and the kernel 4 MB, with a further 1.56 GB of shared memory in system RAM. Anyone who has blamed a model for a full GPU while the compositor and a browser held more will recognise this screen.
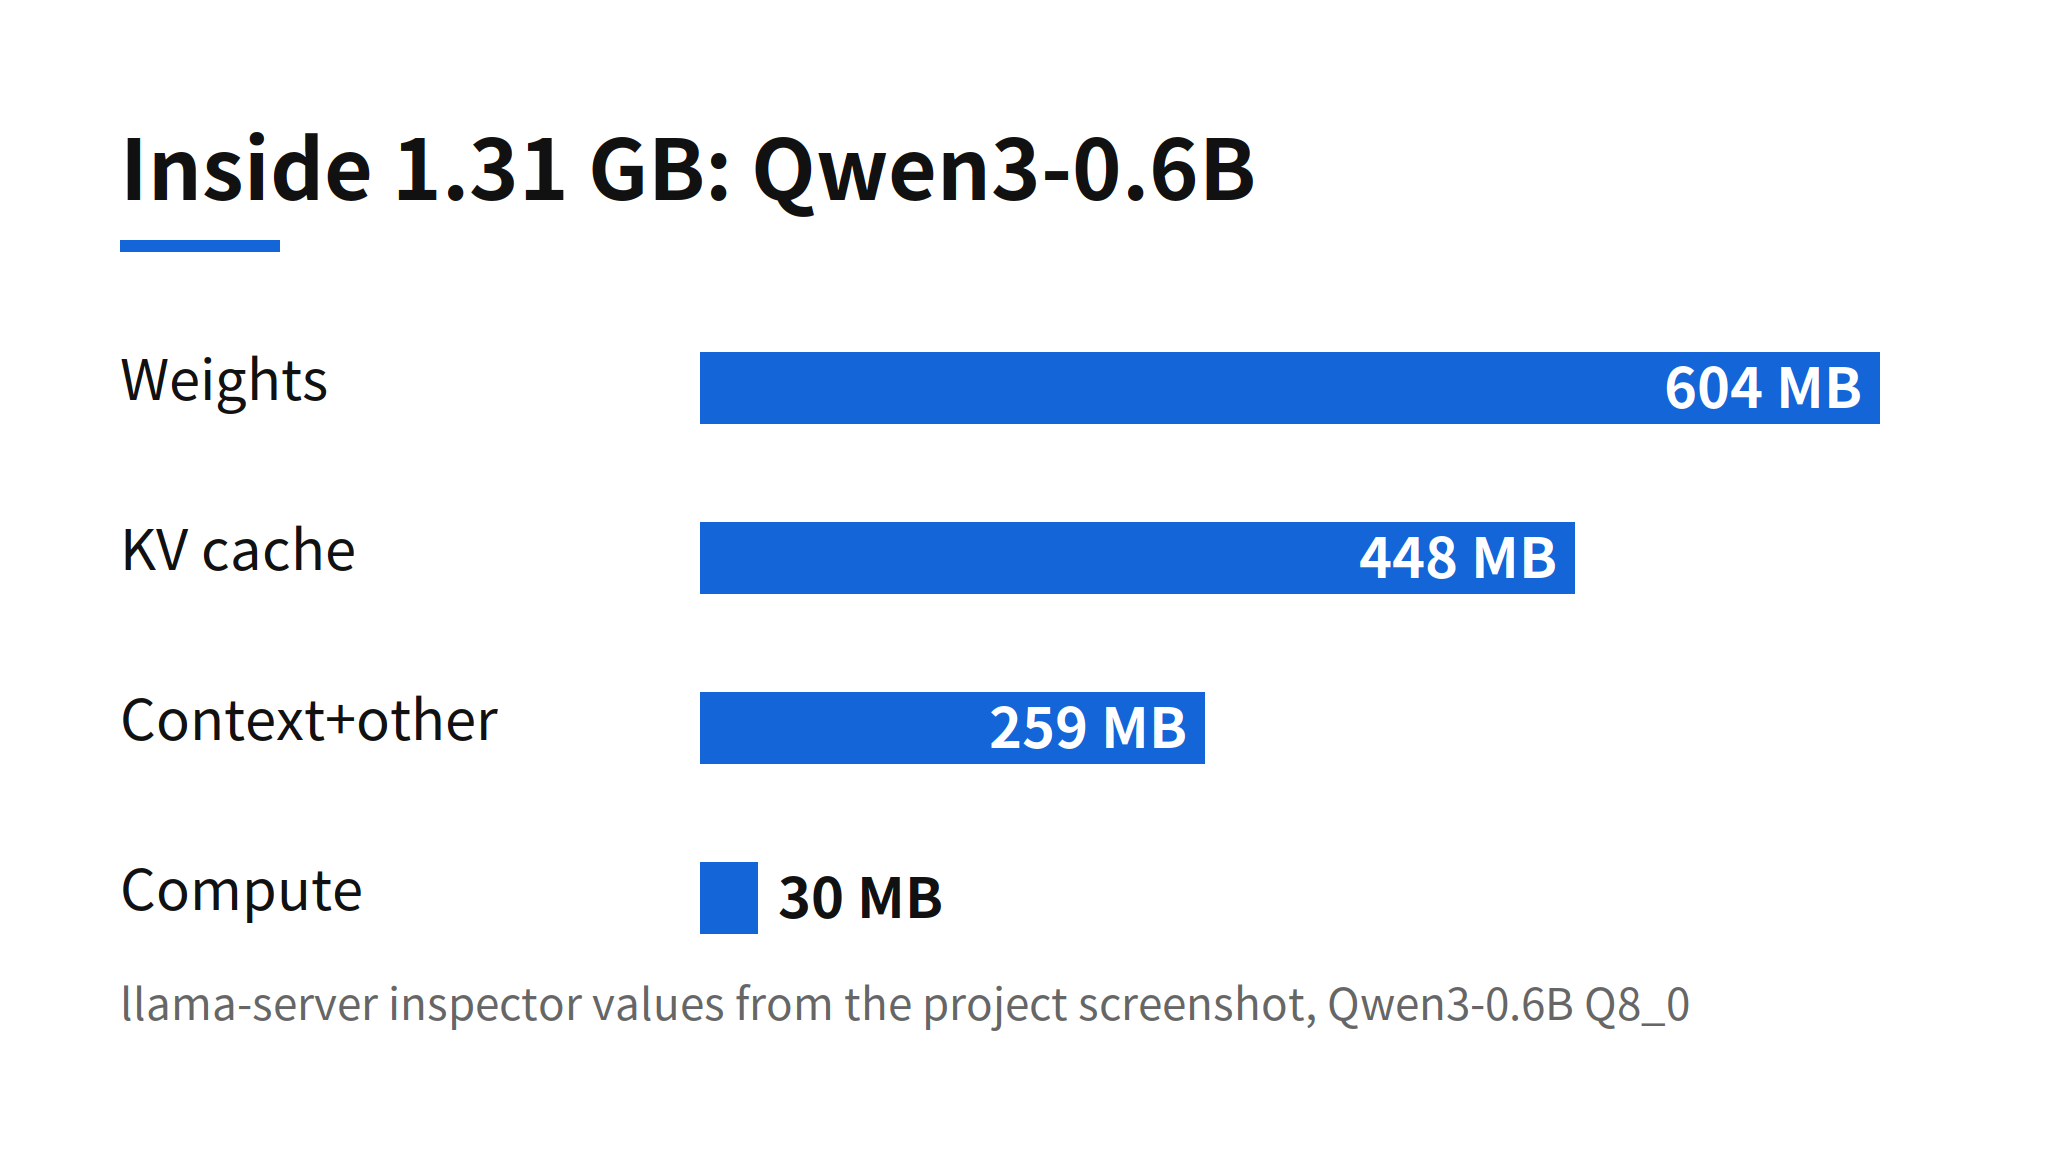
Selecting the llama-server row opens the inspector, and this is where the tool separates itself from nvidia-smi and vendor panels. The process holds 1.31 GB, and the split is 604 MB of weights for a Qwen3-0.6B Q8_0 model, 448 MB of KV cache, 30 MB of compute buffers and 259 MB of CUDA context, cuBLAS and other overhead. The inspector also prices the context directly: KV costs 112 KB per token in f16, so a 4K context is 448 MB while a 32K context would be 3.50 GB. That one line turns a vague out-of-memory failure into an arithmetic problem you can solve before restarting the server.
The per-process columns carry the rest of the diagnosis. Spill shows how much of a process has overflowed into system RAM, which is the usual reason a workload that fits on paper runs slowly. Paged gives an estimated non-resident figure, and the GPU, 3D, copy and video columns show which engines a process is actually using. A process can hold gigabytes and be idle, or hold little and saturate the GPU, and the table keeps those two facts separate.
How the Numbers Are Collected
The README is unusually explicit about evidence, and the help screen lays the layers out in order. Device totals, load, bandwidth, PCIe and power come from NVML on NVIDIA hardware. Per-process VRAM, spill and per-engine load come from Windows WDDM counters, which cover every API including CUDA. The runtime column, CUDA, Vulkan, D3D12, ggml, ONNX or PyTorch, is read from the DLLs mapped into the process. The model file is identified from memory-mapped files plus the command line, which covers llama.cpp, LM Studio, Ollama and llama-cpp-python. Only the last layer, the weights, KV cache and compute split, depends on GGUF header math, llama.cpp or Ollama logs, and local server APIs.
That layering matters because the layers do not deserve equal trust. The project states the rule plainly: device and process counters are measurements, while classifications and GGUF-derived breakdowns are estimates. A mapped DLL alone cannot identify a model or prove training, and a mapped file does not prove a model is resident on the GPU. Where a server log reports real buffer sizes, the numbers stop being estimates. In the project's spot checks against llama.cpp, the Qwen3-0.6B Q8_0 weights estimate of 604.15 MiB matched the runtime log at 604.15 MiB, and the 8,192-context KV estimate of 896 MiB matched the log at 896 MiB.
Installation and First Run
- Install from PyPI. Run
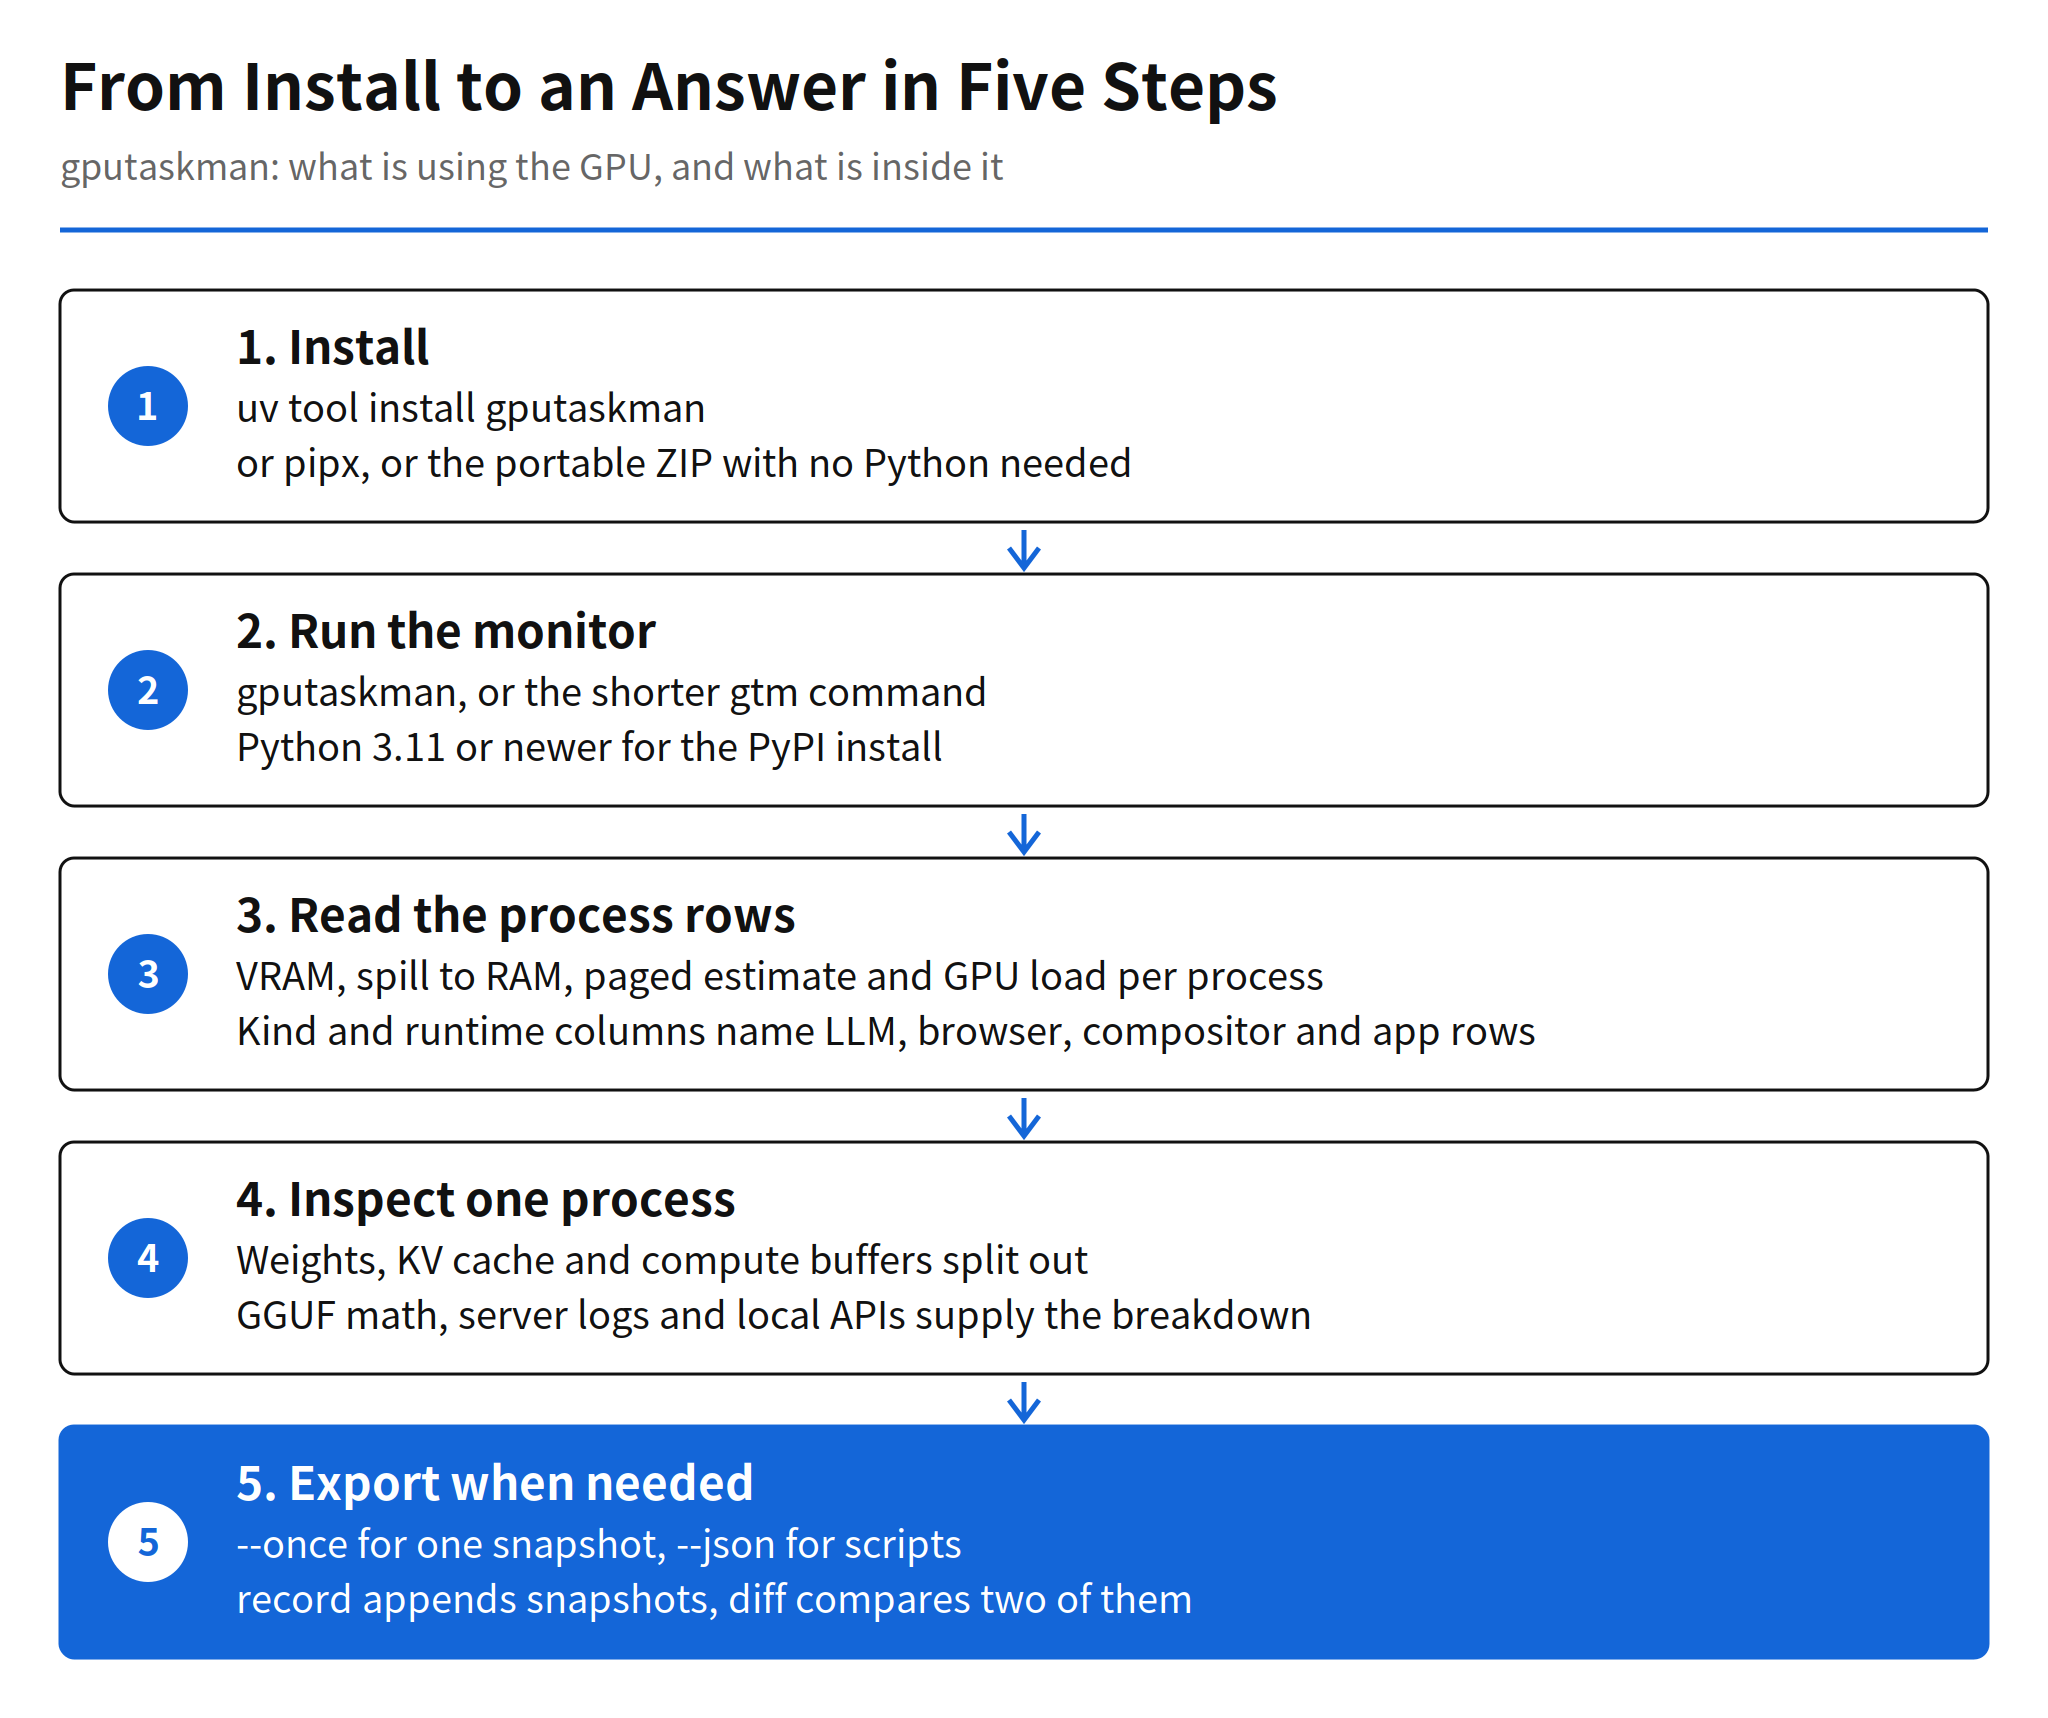
uv tool install gputaskmanorpipx install gputaskman. Both keep the app in an isolated environment, and the PyPI route needs Python 3.11 or newer. Upgrade withuv tool upgrade gputaskmanorpipx upgrade gputaskman. - Or skip Python entirely. Tagged releases publish portable builds: ZIP files for Windows x64 and Windows ARM64, and tar.gz files for Linux x64 and ARM64, the Linux ones needing glibc 2.35 or newer. Extract the whole archive, keep the
_internalfolder beside the executable, and run it. The Windows builds are currently unsigned. - Run the monitor. Type
gputaskman, or the shortergtm. No CUDA Toolkit, administrator session, API key or model download is required just to monitor the GPU. - Read the rows, then inspect. Sort by VRAM, find the holder, and open the inspector on an LLM process to get the weights, KV cache and compute split plus the per-token KV cost.
- Export when a script needs it.
--onceprints one snapshot,--jsonemits machine-readable output,recordappends one JSON snapshot per interval to a JSON Lines file, anddiffcompares two snapshots. Unavailable counters are null in JSON, not a measured zero.
A source install is also documented: clone the repository and run uv run --locked gputaskman, and uv will fetch the pinned Python and dependencies. The first run needs internet access. On Windows, the README recommends Windows Terminal, and live checks listed include an RTX 4080 SUPER and an RTX Spark N1X on Windows ARM64.
Platform Coverage and Operating Modes
Windows is the deepest platform. NVIDIA and AMD telemetry combine with WDDM per-process memory and engine counters, and Intel and Qualcomm adapters use the same WDDM counters where they exist. An integrated adapter reporting at most 512 MiB of dedicated memory is treated as integrated, so its per-process local usage is shown as shared RAM rather than VRAM.
Native Linux splits by vendor. NVIDIA works through NVML, including inside containers and WSL. AMD on the amdgpu driver needs no ROCm and no extra package, because the kernel already exposes device and per-process data through sysfs and DRM fdinfo, with GTT shown as shared memory. Intel on i915 uses the same DRM route. Huawei Ascend 310P chips are read through npu-smi, with memory refreshed every 10 seconds. Linux has no equivalent of the WDDM shared and commit counters, so spill and paged stay blank instead of showing a fake zero.
WSL has three distinct modes, and the UI says which one it is in. With interop on, per-process VRAM for Linux processes is matched from the Windows host and marked as matched. With interop off or --no-host, per-process VRAM for Linux rows is not available and only device totals remain. Containers add one more matching problem, because NVML reports host PIDs that mean nothing inside the container namespace. gputaskman pairs them with container processes that have libcuda mapped, marks confident matches and uncertain ones differently, and shows anything left over as an outside process rather than guessing a name.
macOS on Apple Silicon is supported through IOKit device stats and the footprint tool for GPU memory, with the memory-map scan reading model files. The troubleshooting table in the README still contains a stale line saying macOS is not supported, which conflicts with the dedicated macOS section and the macOS CI jobs. The section and the CI matrix are the stronger evidence, but the stale line is worth knowing about before quoting the table.
My read: the durable idea here is not the TUI. It is the evidence discipline. Every number in the interface is either a counter the project names, or an estimate the project labels, and unavailable data renders as blank or null instead of zero. GPU tooling usually hides exactly those distinctions, which is why so many memory arguments are unfalsifiable. A monitor that shows its own confidence per layer is one you can actually debug with.
Limits and Unconfirmed Points
- Early, experimental software: the README says so in the second paragraph. Classifications and GGUF-derived breakdowns are estimates, and accuracy across GPU vendor and driver combinations is unconfirmed in the issue record.
- Estimates can run high: in the project's own spot checks, a Gemma-3-270M KV cache at 4,096 context estimated at a 72 MiB upper bound against 49.5 MiB in the runtime log, because sliding-window attention uses less. Partial offload, KV quantization, architecture differences and multiple models in one process can all move the split.
- Per-model accounting gap: separate runner processes get separate rows, but per-model KV accounting inside a single process is not yet supported.
- Unsigned Windows builds: the portable Windows ZIP files are not code-signed, and there is no installer yet. That is a deployment decision each user makes for themselves.
- Unvalidated hardware corners: multi-GPU WSL matching is not validated, Intel Arc B580 behaviour is covered by mocked counters without hardware validation, and the Ascend path rests on a contributor report that the README says has not been independently validated.
- Privacy surface: the tool sends no telemetry and does not dump model weights, but the normal inspector and JSON output can contain paths, command-line flags, model names and local ports. The README tells users to review and redact captures before posting them publicly.
- Large training environments unconfirmed: the live checks are single-machine desktops, laptops, a rented container and a Mac mini class device. Behaviour on large multi-GPU training hosts has no published validation yet.
FAQ
What is gputaskman?
gputaskman is a terminal GPU task manager for Windows, Linux, WSL and macOS on Apple Silicon. It shows per-process VRAM, spill to system RAM, paged estimates and GPU engine activity, and for LLM processes it splits the memory into model weights, KV cache and compute buffers. The project describes itself as an htop for what is inside the GPU, not just how full it is.
How do you install gputaskman?
Install it from PyPI with uv tool install gputaskman or pipx install gputaskman, then run gputaskman or the shorter gtm command. The PyPI route needs Python 3.11 or newer. Portable ZIP and tar.gz builds for Windows and Linux need no Python at all, and the Windows builds are currently unsigned.
Which GPUs and platforms does gputaskman support?
On Windows it covers NVIDIA and AMD telemetry plus Intel WDDM activity. On native Linux it covers NVIDIA through NVML, AMD through the amdgpu driver, Intel through i915, and Huawei Ascend 310P through npu-smi. WSL works through NVML plus Windows host counters when interop is on, and macOS is supported on Apple Silicon.
Are the weights and KV cache numbers exact?
No. Device and process counters are measurements, but classifications and GGUF-derived breakdowns are estimates, and the README says so. The split gets exact only where runtime logs or local server APIs report real buffer sizes. Sliding-window attention is one documented case where the GGUF estimate runs high.
Related Reading
- gpu-unlock for RTX 30: BF16 Gains up to 80% Claimed, another local GPU tooling release, on unlocking performance instead of inspecting memory